Student Dashboard
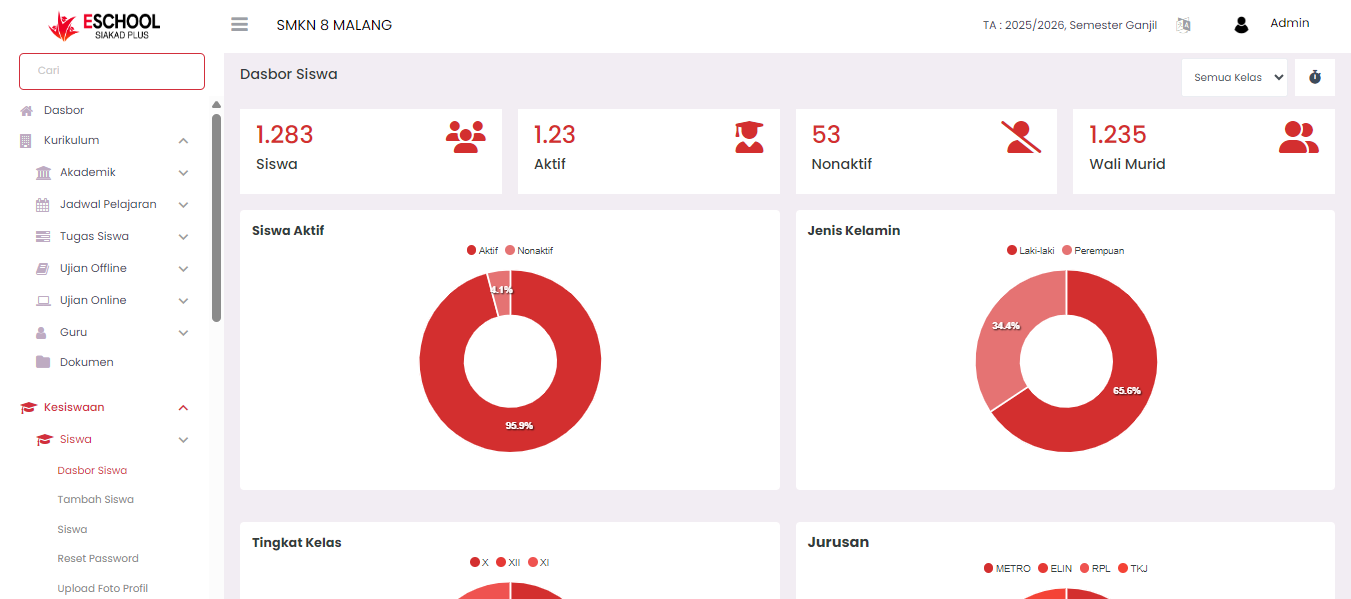
The Student Dashboard is a visual information center that presents real-time overall student statistics and data in eSchool. This menu is designed so that admins, principals, and school operators can get a comprehensive overview of student conditions and compositions quickly and easily.
Main Information
The top of the dashboard displays four key indicators:
| Indicator | Description |
|---|---|
| Number of Students | Total number of students registered in the system. |
| Active Students | Number of students currently with active status. |
| Inactive Students | Number of students who have left, graduated, or other inactive statuses. |
| Number of Guardians | Total guardian accounts registered and connected to students. |
Statistical Visualization
Active Students
- Donut chart comparing the proportion of active and inactive students.
- Example: 95.9% active and 4.1% inactive.
Gender
- Displays the Male vs Female ratio of all students.
- Example: 65.6% male, 34.4% female.
Grade Level
Percentage distribution of students based on level:
- Grade X
- Grade XI
- Grade XII
Useful for monitoring the balance of students at each level.
Major
Statistics on the number of students based on major:
- RPL, TKJ, ELIN, METRO
Shows the distribution of interests and potential class/major ratios.
Filter and Interaction
- A class filter dropdown is available at the top right (default: "All Classes") allowing users to customize the displayed data based on specific levels.
- Data will automatically update according to the selected filter.
Main Benefits
- Quick Monitoring: Provides a visual and informative summary of student data.
- Decision Making: Helps school management in formulating academic strategies and policies based on factual data.
- Imbalance Detection: With gender, major, and level visualization, schools can anticipate imbalances early.
Notes
- This data is aggregate, not per individual. For detailed student data, use the Student > Student List menu.
- Ensure student data is always updated so that visualizations remain accurate.
Need Further Help?
If you require further assistance, contact us through the eSchool Help page.