Curriculum Dashboard
The Curriculum Dashboard in E-SCHOOL Siakad Plus is a strategic information hub that presents academic data in interactive, informative, and real-time visual form. With this feature, school management can understand the distribution of subjects, majors, classes, and study groups quickly and accurately.
Main Statistical Summary
At the top of the dashboard, users are immediately presented with important numbers, for example:
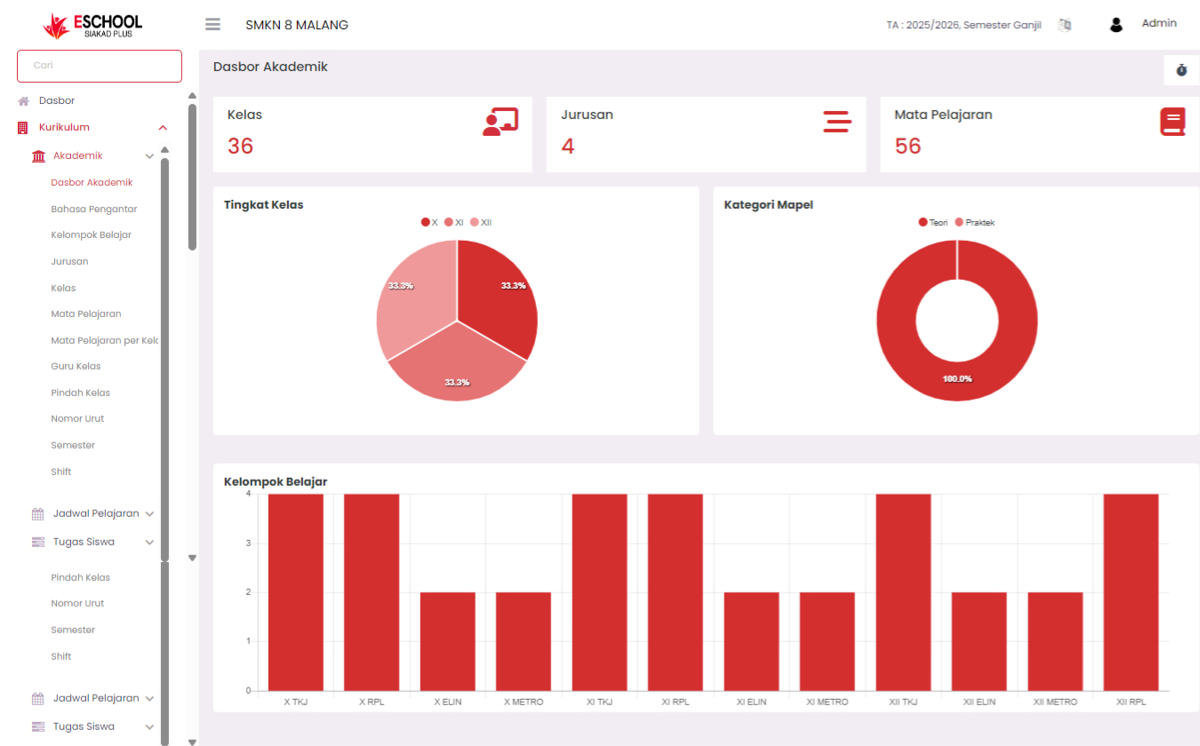
- Total Classes: 36 active classes recorded.
- Total Majors: 4 majors available.
- Number of Subjects: 56 subjects registered in the system.
These statistics provide a macro view of the scope of the curriculum currently running at the school.
Academic Visualization
Class Levels
- Displayed in the form of a pie chart that divides classes, for example:
- X
- XI
- XII
- Each has a proportional distribution (33.3%), showing the balance of the number of classes at each level.
Subject Categories
- Displayed in the form of a donut chart.
- All registered subjects fall into the Theory (100%) category — an indicator that the curriculum structure is more theory-based, and allows schools to consider adding practical subjects if needed.
Study Groups
- Bar chart displays the distribution of study groups based on combinations of level and major, such as:
- X TKJ, X RPL, XI ELIN, XII METRO, and others.
- This visual is very helpful for knowing the density of study groups directly and arranging the distribution of lesson hours or teachers.
Functions and Benefits of Dashboard
| User | Specific Benefits |
|---|---|
| Vice Principal of Curriculum | As a monitoring tool for class and subject distribution for planning purposes |
| Principal | Presents academic summary for evaluation and reporting |
| Teachers and Staff | Know the distribution of study groups they teach |
| Academic Operator | Facilitates the validation process of class data, majors, and curriculum structure |
Feature Advantages
- Real-time Data: All graphs and numbers are automatically updated according to changes in academic structure.
- Easy-to-Read Visuals: Uses interactive diagrams that speed up decision making.
- Curriculum Evaluation Basis: Becomes a strategic foundation in designing curriculum changes or development.
If you need further assistance, contact us through the eSchool Help page.